
Quick answer
In Windows 11 or 10, open Task Manager, select Performance, then choose your GPU. If the graphics driver supports temperature reporting, the current reading appears near the utilization statistics. For more detailed sensor data, try a reputable hardware monitor such as HWiNFO or GPU-Z.
On Linux with an NVIDIA GPU, run:
nvidia-smi --query-gpu=temperature.gpu,utilization.gpu,power.draw --format=csvFor AMD and some Intel GPUs, temperature sensors may be available through the sensors command.
Most desktop GPUs sit at roughly 30–55°C while idle and reach 60–85°C during sustained gaming or rendering. Treat these as general reference ranges, not limits that apply to every card. Hotspot temperatures are usually higher than the main GPU temperature, and each GPU model has its own maximum permitted temperature.
How to check GPU temperature in Windows
Check it in Task Manager
- Press Ctrl + Shift + Esc to open Task Manager.
- Select Performance. If the tabs are hidden, expand the window or open the navigation menu.
- Choose GPU 0, GPU 1, or whichever entry matches your dedicated graphics card.
- Find the temperature reading below the graphs.
If there’s no temperature reading, update the graphics driver and restart Windows. Task Manager may not display temperatures for unsupported drivers, integrated GPUs, virtual GPUs, or certain older graphics cards.
Use a detailed hardware monitor
HWiNFO and GPU-Z can show readings that Task Manager leaves out. Depending on the card, these may include GPU core temperature, hotspot or junction temperature, memory temperature, fan speed, clock rate, and power use. Download any monitoring software from its official publisher, not a third-party download site.
With HWiNFO, launch the program in sensors-only mode and locate the section named after your graphics card. The Current, Minimum, Maximum, and Average columns show how the GPU behaves while a workload is running.
How to check GPU temperature in Linux
NVIDIA GPUs
The proprietary NVIDIA driver includes nvidia-smi. To refresh the status every second, use:
watch -n 1 nvidia-smiPress Ctrl + C when you want to stop monitoring. If the command is missing, the NVIDIA driver or its utilities package probably isn’t installed correctly.
AMD and Intel GPUs
Install the lm-sensors package with your distribution’s package manager. On Debian and Ubuntu-based systems, run:
sudo apt update
sudo apt install lm-sensors
sensors
AMD readings may appear under an amdgpu device, with labels such as edge, junction, or mem. The Intel readings available will depend on the GPU, kernel, and hardware-monitoring support. For continuous updates, run:
watch -n 1 sensorsSafe GPU temperature ranges
- Idle or light desktop use at 30–55°C. Fan-stop modes and a warm room can lead to higher idle readings without pointing to a problem.
- Gaming or GPU workloads at 60–85°C. Many graphics cards are built to run continuously across this broad range.
- Core temperatures above 85°C. Check the card’s specifications, fan speed, airflow, and clock behavior. Some models allow higher temperatures, but repeatedly nearing the thermal limit can lower boost clocks.
- Hotspot or junction temperature. This reading may be 10–25°C higher than the reported core temperature. Compare it with the manufacturer’s limit for your exact GPU, rather than using a core-temperature guideline.
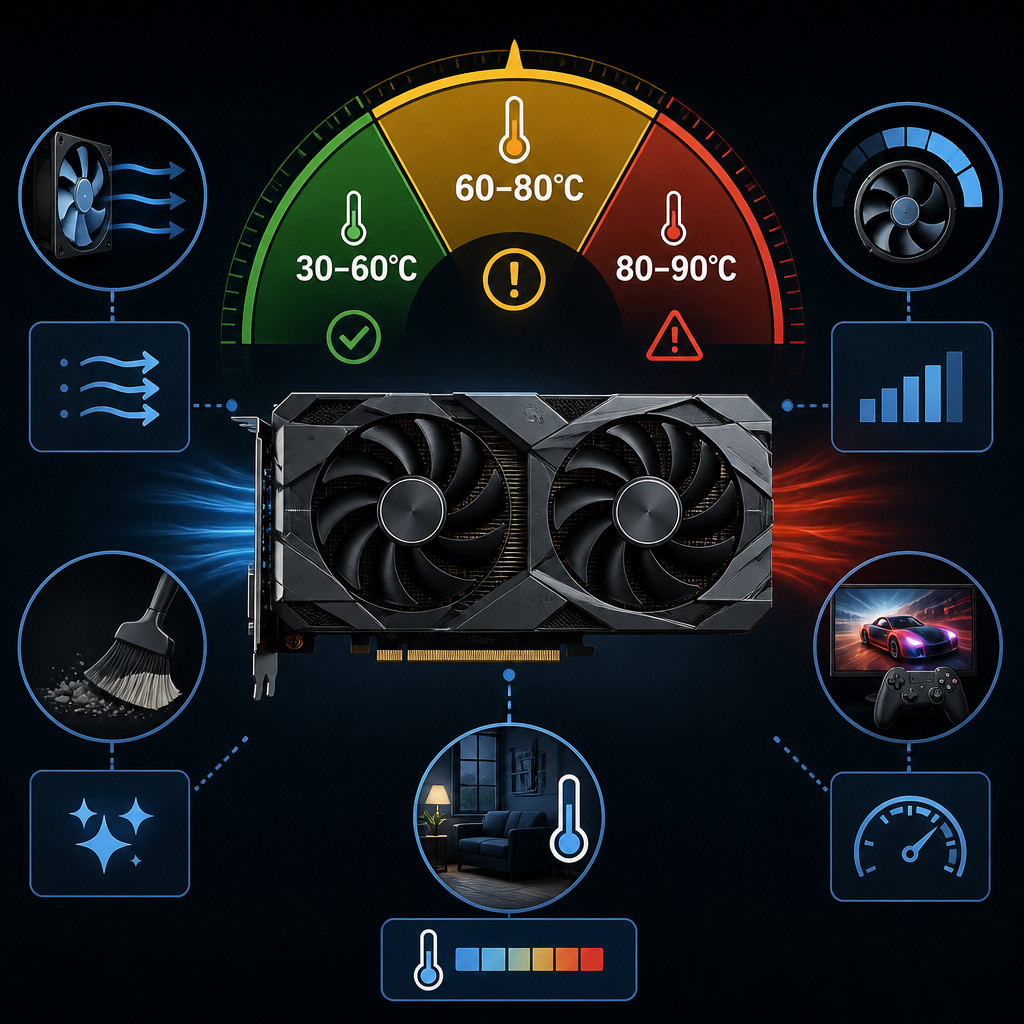
Some GPUs are designed to run close to a temperature target, automatically changing boost frequency and fan speed as needed. The most dependable limit is the maximum operating or junction temperature published for the exact GPU model.
How to test GPU temperature under load
- After the computer has been sitting at the desktop for about ten minutes, record the idle temperature.
- Launch a game or another workload you regularly use. Don’t run an extreme stress test unless you understand its power and thermal behavior.
- Keep the workload running for 15–30 minutes, giving the cooler time to reach a stable temperature.
- Record the maximum core, hotspot, memory, fan-speed, and clock readings where available.
- Look for falling clock speeds, severe stuttering, visual artifacts, driver resets, or shutdowns.
Repeat the tests under similar conditions. Room temperature makes a difference, so the same GPU will generally run hotter during summer or in a room with poor ventilation.
How to lower GPU temperature safely
- Improve case airflow. Make sure front or bottom fans draw cool air into the case, while rear or top fans push warm air out.
- Clear away dust. Turn off and unplug the computer before cleaning its filters, heatsinks, and fans. When using compressed air, stop the fan blades from spinning freely.
- Check that the fans work. Zero-RPM operation at idle is normal, but the fans should begin spinning as the GPU heats up under load.
- Give the card more clearance. Don’t place the computer directly against a wall or fit the GPU tightly beside another expansion card.
- Change the fan curve. A more aggressive curve can reduce temperatures, though it will also create more noise.
- Cut unnecessary GPU load. Set a reasonable frame-rate limit or reduce demanding graphics settings.
- Consider undervolting. A carefully tested undervolt may lower power use and heat. Unstable settings can cause applications to crash, so restore the defaults if problems appear.
Replacing thermal paste or thermal pads means taking the graphics card apart and could affect its warranty coverage. Consider it an advanced repair, and only after you’ve ruled out dust, airflow, fan, driver, and workload problems.
Common GPU monitoring mistakes
- Comparing one card’s hotspot temperature with another card’s core temperature.
- Assessing cooling performance from a short temperature spike instead of a sustained workload.
- Assuming that stationary fans at idle mean the graphics card is faulty.
- Overlooking the effects of room temperature and case airflow.
- Following a temperature limit meant for a different GPU model or architecture.
- Running several monitoring tools that conflict or use different labels for the same sensors.
Frequently asked questions
Is 80°C safe for a GPU while gaming?
For many desktop GPUs, a sustained core temperature of 80°C while gaming is within the designed operating range. Still, confirm the thermal limit for your exact model. If the temperature keeps rising, check the hotspot reading, fan speed, and clock behavior as well.
Why is the GPU hotspot hotter than the core?
The main GPU reading represents a broader or selected sensor value, while the hotspot identifies the hottest measured area of the die. Some difference is normal. If that gap becomes unusually large or has grown over time, it may point to uneven cooler contact or degraded thermal material.
Can high temperatures damage a graphics card?
Modern GPUs generally lower their clock speeds or shut down before immediate thermal damage occurs. Even so, repeatedly running near the thermal limit may reduce performance and speed up wear on fans or other components. Persistent overheating should be checked.
Why doesn’t Task Manager show my GPU temperature?
The GPU, Windows display driver, or driver model may not support temperature reporting in Task Manager. Install the latest stable driver from the GPU or computer manufacturer, restart Windows, and switch to a dedicated hardware-monitoring utility if the reading still doesn’t appear.
